.png)
Risk-Based Inspection: How Smart Plants Stop Treating Every Asset the Same


When the Inspection Schedule Becomes the Problem
Two pressure vessels. Same vintage. Same design code. One is in a low-corrosivity stream with stable operating conditions. The other handles wet H2S with cyclic thermal loads and an upset history going back several years. Under a traditional time-based inspection regime, they'd both be inspected on the same four-year cycle.
That's the flaw in fixed-interval inspection thinking. It treats all assets as equal, which means the dangerous ones don't get enough attention, and the benign ones get more than they need. Both outcomes cost money. One of them can get severe Health and Safety consequences.
Risk-Based Inspection (RBI) was built specifically to fix this. Rather than assigning inspection intervals by equipment type or a regulatory calendar, RBI evaluates each asset individually based on how likely it is to fail and what the consequences of that failure would be. The result is an inspection programme that's smarter, more defensible, and significantly more effective at actually catching the things that matter.
What RBI Actually Does, and What It Doesn't
RBI is a risk assessment and inspection planning methodology, not a single test or technique. At its core, it combines two analyses: Probability of Failure (POF) and Consequence of Failure (COF). Multiply the two, and you get a risk ranking. That ranking drives everything else: inspection frequency, the techniques used, the scope of each inspection, and the timeline for re-assessment.
The governing standards in industry practice are API RP 580 (the methodology standard, covering the principles and process of RBI) and API RP 581 (the quantitative data standard, covering failure probability calculations, damage factor tables, and consequence modelling). Both are published by the American Petroleum Institute and are widely adopted in refineries, petrochemical plants, oil and gas facilities, and chemical processing units worldwide.
What RBI is not: it isn't a replacement for engineering judgment, and it doesn't eliminate the need for inspections. It tells you where to focus. A low-risk asset with extended inspection intervals still needs to be monitored. A high-risk asset with quarterly PAUT inspections still needs engineers who understand what the data means.
How the RBI Methodology Works, Step by Step
The methodology follows a structured sequence. Each step feeds into the next, and the process loops back as new inspection data becomes available. Here's how a typical RBI analysis is structured in line with API RP 580:
Table 1: RBI Workflow and Governing Standards (API RP 580 / API RP 581)
RBI Step | What Happens | Key Output | Governing Standard |
1. Equipment Identification | Scope all pressure-containing items: vessels, piping, exchangers, tanks | Asset register with operating parameters | API RP 580 Sec. 5 |
2. Damage Mechanism Review | Map active degradation mechanisms per asset: corrosion, SCC, erosion, fatigue, HTHA, CUI | Degradation mechanism matrix | API RP 571 |
3. Probability of Failure (POF) | Calculate likelihood of failure using thinning rates, inspection history, material condition, and process data | POF score per asset | API RP 581 Part 2 |
4. Consequence of Failure (COF) | Assess safety, environmental, production, and financial impact of each failure scenario | COF category (safety / financial) | API RP 581 Part 3 |
5. Risk Ranking and Matrix | Combine POF and COF into a risk matrix; rank all assets from high to low risk | Prioritized asset risk ranking | API RP 580 Sec. 6 |
6. Inspection Planning | Set inspection methods (PAUT, TOFD, UT, RT, AUT), intervals, and scope per risk rank | Risk-based inspection plan | API RP 580 Sec. 8 |
7. Results Integration and Re-assessment | Feed inspection findings back into the risk model; update POF, adjust future inspection dates | Updated risk register; revised intervals | API RP 580 Sec. 9 |
Damage Mechanism Review: The Step Most Plants Get Wrong
Step 2 deserves more attention than it usually gets. A damage mechanism review (DMR) identifies the specific degradation pathways active for each asset: general corrosion, localised pitting, stress corrosion cracking (SCC), high-temperature hydrogen attack (HTHA), corrosion under insulation (CUI), erosion-corrosion, creep, fatigue, and others. API RP 571 catalogues 64 damage mechanisms relevant to refinery and chemical plant equipment.
Getting the DMR wrong means you're calculating probability of failure for the wrong failure mode. We've seen cases where plants ran TOFD on welds to detect volumetric flaws, while the actual damage mechanism was SCC initiating from the weld toe on the external surface. The inspection found nothing, not because there was nothing there, but because it was looking in the wrong place with the wrong technique.
Probability of Failure: More Than a Gut Check
POF quantification in API RP 581 is built on a generic failure frequency baseline modified by damage factors. The damage factors account for thinning rate, susceptibility to specific cracking mechanisms, past inspection quality, process upsets, and the effectiveness of previous inspections.
An asset with a high thinning rate, no recent inspection history, and known susceptibility to stress corrosion cracking in its service environment will carry a very different POF than an identical asset in a benign stream with documented inspections every two years. That difference should drive the inspection plan. Often, it doesn't in time-based programmes, because the schedule treats them the same.
One thing worth understanding: POF in RBI is not a precise probability in the statistical sense. It's a relative ranking. What matters is whether Asset A is higher risk than Asset B, not whether the absolute number is 0.0003 or 0.0008. The methodology is calibrated for comparison and prioritisation, not for predicting exact failure dates.
Consequence of Failure: Safety, Environment, Production, Finance
COF analysis looks at what happens if the equipment fails. API RP 581 breaks consequences into safety/environmental consequences (modelled as toxic or flammable release scenarios, injury probability, area affected) and financial/production consequences (downtime cost, repair cost, product loss). Both are normalised so they can be combined into a single risk score.
In practice, high COF often drives the inspection decision more than high POF. A storage tank in a diesel service might have low probability of failing. But if it's located 20 metres from a process heater and the consequence of a full-bore rupture is catastrophic, it earns a high-risk classification regardless. That's appropriate. The consequence hasn't changed just because the probability is low.
This is where RBI differs most fundamentally from compliance-based inspection. Compliance says "inspect this class of equipment every X years". RBI says "the consequence of failure here is severe enough that we need to know its current condition, regardless of when we last looked".
RBI in Chemical Plants and Refineries: Where the Stakes Are Highest
The sectors where RBI earns acceptance are refineries, petrochemical complexes, fertilizer plants, and oil and gas processing facilities. These environments have the most complex damage mechanism mix, the highest consequence of failure, and typically the oldest assets still in operation.
In a typical crude distillation unit, you're dealing with high-temperature sulfidic corrosion in the hot ends, naphthenic acid attack in the 220-400°C range, hydrogen blistering and HIC in the sour fractions, and chloride SCC in the overhead condensers. Each of those damage mechanisms needs to be identified, characterised for each asset, and factored into the POF calculation individually.
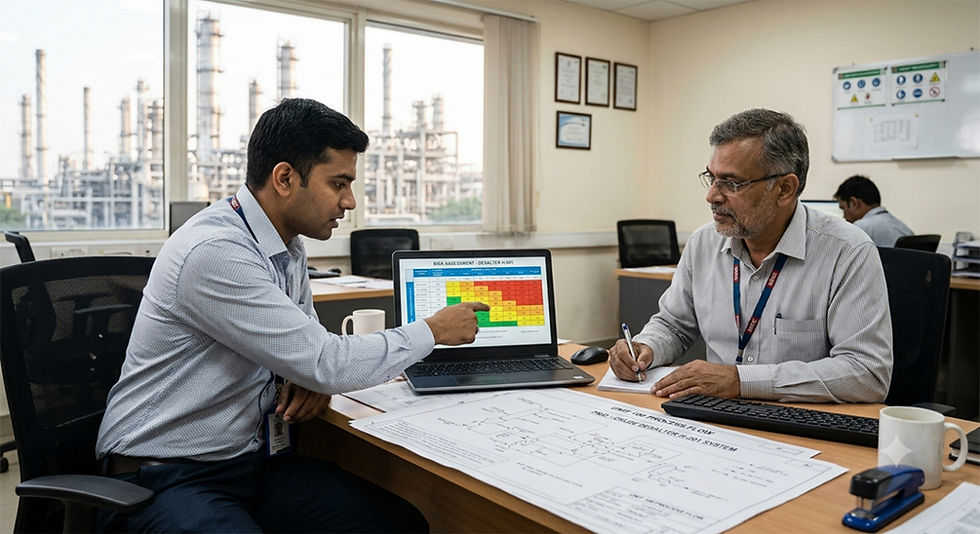
RBI in chemical plants adds another layer: the consequence modelling has to account for toxic release scenarios that don't apply in refineries. An ammonia synthesis loop, a chlorine header, or a phosgene-based process stream carries consequences that make the COF calculation very different from a hydrocarbon service line. The risk matrix for a chemical plant looks different from a refinery, which is why RBI must be tailored to the specific plant, not applied from a generic template.
Inspection Planning Based on Risk: Getting the Techniques Right
Once the risk ranking is established, the inspection plan defines what method to use, how often, and to what extent. This is where RBI connects directly with NDT capability.
High POF driven by thinning typically means thickness mapping with automated ultrasonic testing (AUT) or phased array UT (PAUT) to get wide area coverage. High POF from cracking mechanisms means TOFD or phased array techniques capable of detecting tight, vertically oriented cracks that conventional UT would miss. CUI risk means targeted removal of insulation at high-susceptibility locations combined with radiographic profiling or guided wave UT for screening.
The inspection technique has to match the damage mechanism. RBI tells you what damage mechanism is active. The NDT selection follows from that. Running magnetic particle testing on an asset susceptible to subsurface hydrogen-induced cracking tells you almost nothing useful. The risk model and the inspection response have to be aligned.
Inspection intervals in a risk-based plan are not fixed. An asset that starts at medium risk might shift to high risk as it ages, as thinning measurements confirm faster-than-expected corrosion, or as process conditions change. The RBI model is re-evaluated at each inspection, and intervals are tightened or extended accordingly. This living plan approach is what separates RBI from a document that gets filed and forgotten.
The RBI Cycle: From First Assessment to Ongoing Re-evaluation
FLOWCHART: RBI Decision and Re-assessment Cycle
Step 1: Scope Definition — Identify all pressure-containing equipment in scope; compile asset register with design and operating data and service fluid.
Step 2: Damage Mechanism Review — Identify active degradation pathways per asset using API RP 571; document susceptibility
Step 3: POF Assessment — Calculate probability of failure using API RP 581 damage factors, thinning rates, and inspection history
Step 4: COF Assessment — Model safety, environmental, production, and financial consequences per failure scenario
Step 5: Risk Ranking — Place each asset on a risk matrix; classify as High / Medium / Low risk
Decision: Is risk acceptable?
YES: Assign inspection interval based on risk category; document inspection plan
NO: Define risk mitigation (increased inspection frequency, process change, repair, FFS assessment, or replacement)
Step 6: Inspection Execution — Carry out inspections using techniques matched to active damage mechanisms
Step 7: Results Integration — Feed findings back into risk model; update POF, adjust future intervals; re-assess risk ranking
Loop back to Step 3 continuously as new data comes in
What a Good RBI Implementation Looks Like
The difference between RBI done well and RBI done poorly usually comes down to data quality and engineering engagement. A risk model built on assumed corrosion rates instead of actual measurement data, or on damage mechanism assignments copied from a generic table without plant-specific review, gives you a risk ranking that's defensible on paper but not reliable in practice.
Good RBI implementation starts with a thorough equipment history review. Corrosion allowance consumption rates, previous inspection findings, upset logs, process fluid analysis, inhibitor records, all of it goes into the model. The more plant-specific data you have, the more accurate the risk ranking.
It also requires that the inspection findings are properly fed back into the model. A team that inspects in April and doesn't update the RBI register until December has broken the loop. The risk model needs to reflect current asset condition, not condition as it was 18 months ago.
The Case for Risk-Based Thinking in Asset Inspection
Plants that move to RBI don't necessarily inspect less. They inspect differently. The total inspection manhours may be similar or even higher in the first implementation cycle as historical data gaps get filled. But the distribution changes dramatically: high-risk assets get intensive attention, low-risk assets get proportionate monitoring, and the inspection budget starts working where it needs to.
The operational payoff shows up as fewer unplanned shutdowns. When you know which assets are carrying the highest risk, you can schedule interventions during planned turnarounds instead of responding to in-service failures that force emergency outages. In refinery and petrochemical environments, one avoided emergency shutdown can offset the entire cost of an RBI programme many times over.
Beyond cost, there's the safety argument, which is the original reason the methodology exists. The assets most likely to injure people or cause environmental releases are the ones that need the most rigorous inspection. RBI makes sure they get it, based on data, not habit.
At TCR Advanced Engineering, our asset integrity team has supported RBI implementation across refineries, petrochemical complexes, fertilizer plants, and oil and gas facilities. We work from first principles: damage mechanism reviews grounded in API RP 571, quantitative POF and COF modelling per API RP 581, and inspection planning backed by our in-house advanced NDT capabilities including PAUT, TOFD, HTHA detection, and AET. With 9,500+ failure investigations completed and 500+ FFS and RLA assessments across 1,800+ clients, our team brings the field experience to make RBI work in practice, not just on paper. Reach us at www.tcradvanced.com or call our 24-hour hotline at +91 8511179948. |
Frequently Asked Questions
What is Risk-Based Inspection (RBI) methodology?
RBI is a systematic approach for planning and prioritising equipment inspections based on quantified risk rather than fixed time intervals. It combines probability of failure (POF) and consequence of failure (COF) analysis to rank assets by risk and assign inspection resources accordingly. API RP 580 governs the methodology; API RP 581 provides the quantitative models.
How does RBI differ from traditional time-based inspection?
Time-based inspection assigns fixed intervals regardless of actual asset condition or risk. RBI evaluates each asset individually using its specific operating environment, damage mechanisms, and failure history. High-risk assets get more frequent or intensive inspection; low-risk assets are monitored proportionally. The result is better use of inspection budgets and higher probability of detecting real damage before it causes failure.
What is Probability of Failure (POF) in RBI?
POF quantifies how likely an asset is to fail within a defined period, based on active damage mechanisms, material condition, thinning rates, inspection history, and process data. API RP 581 uses damage factor tables to modify a generic failure frequency baseline. POF is used as a relative ranking tool, not an absolute prediction.
What is Consequence of Failure (COF) analysis?
COF models what happens if an asset fails. API RP 581 addresses safety and environmental consequences (release modelling, injury probability, area affected) and financial consequences (downtime, repair cost, production loss). High COF assets receive elevated inspection priority even when their POF is relatively low.
Which standards govern Risk-Based Inspection?
The primary standards are API RP 580 (Risk-Based Inspection, covering methodology and process) and API RP 581 (Risk-Based Inspection Technology, covering quantitative models for POF and COF). API RP 571 covers damage mechanisms relevant to refinery and petrochemical equipment and is an essential companion for damage mechanism reviews.
Can RBI be applied in chemical plants and not just refineries?
Yes. RBI is applicable across any industry with pressure-containing equipment where failure carries risk. Chemical plants, fertilizer complexes, power stations, offshore platforms, and pharmaceutical manufacturing facilities all apply RBI principles. The damage mechanisms and consequence scenarios differ by sector, which is why the RBI analysis must be tailored to the specific plant rather than applied from a generic refinery template.


Comments